What we do
Lumics is an infrastructure device monitoring and alerting tool, similar to PRTG, Solarwinds, Nagios, etc. We poll health and performance statistics from devices like physical servers, firewalls, switches, routers, load balancers, wireless controllers, databases, VCenter and individual virtual machines, etc. and alert you to any issues. These statistics include memory/CPU utilization, interface utilization, disk space usage, fan and power supply status, packet loss/latency, syslog info, Netflow details, configuration backups and so much more. Basically, if SNMP, WMI/WinRM or an API can provide us the info, we can present it to you, alert you on it, and keep historicals on it for planning, trending, and reporting.
TECH SHEET DOWNLOAD:
SaaS-Leveraging Cloud-Based Technologies
Licensing
Free License:
» Ping (ICMP)
» HTTP URL Checks
» TCP port Checks
Base license Includes:
» SNMP Discovery/Polling (V1, V2c, V3)
» WMI/WinRM Discovery Polling
» MySql/Mongo DB/Elastic Search polling
» IPAM (IP Address Management)
» Config Backups
Add on Licenses
+ Netflow license
+ API license (Some examples of API licenses are NetApp, Palo Alto, Cisco Meraki, VMWare’s vCenter, etc)
Lumics is packed with features
Widgets:
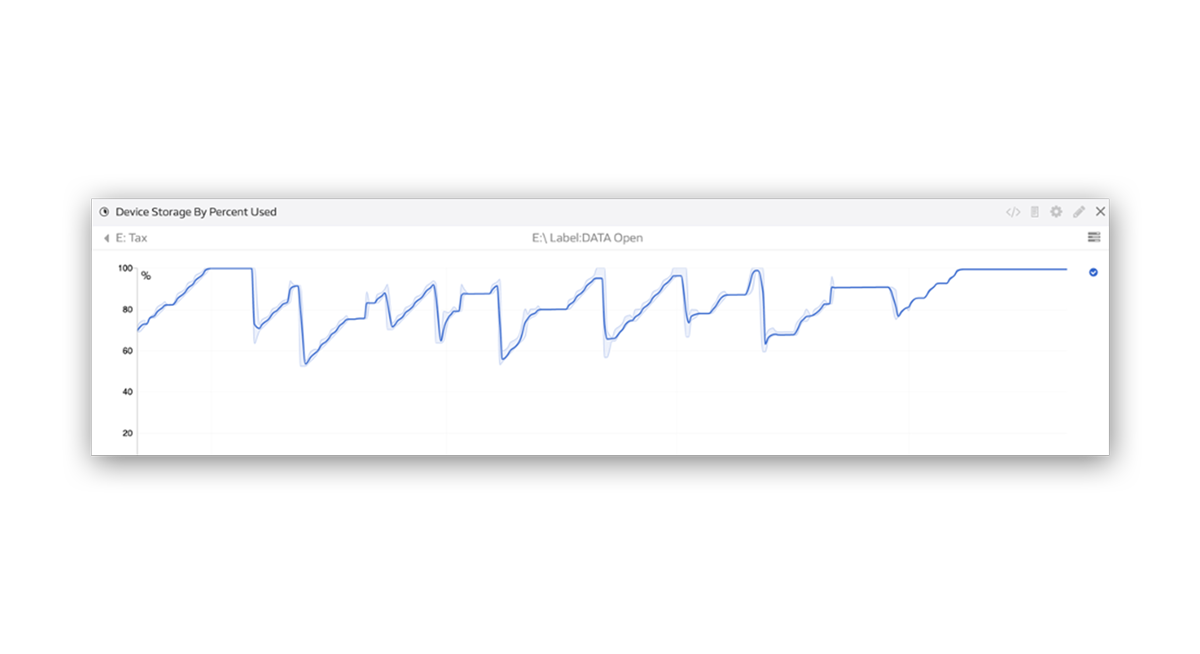
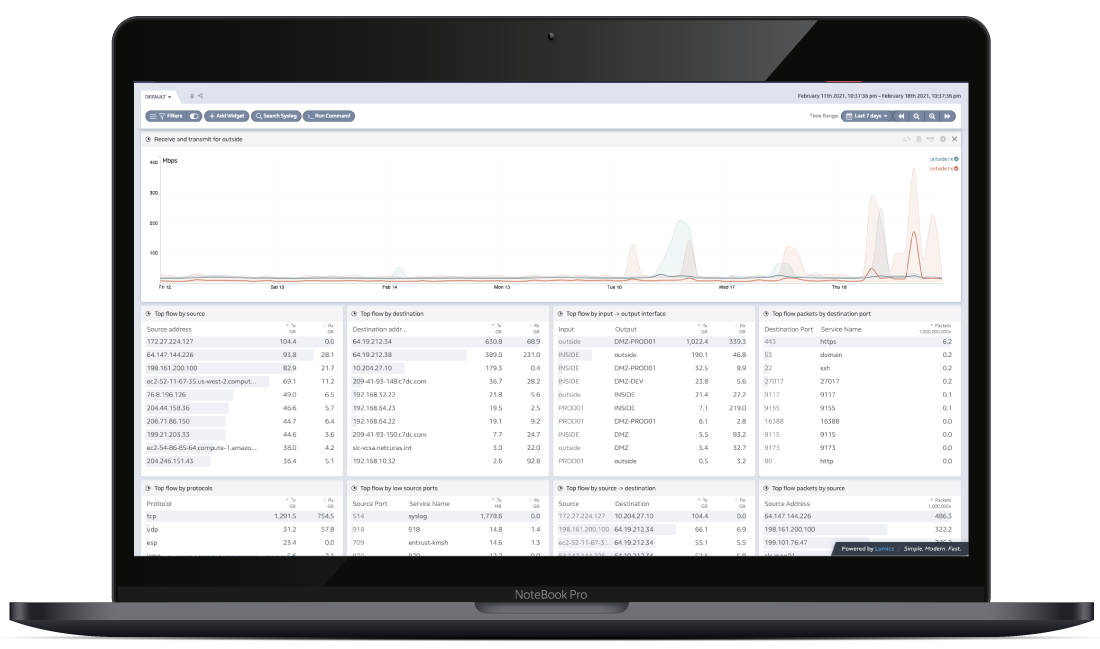
We have 100+ widgets. These widgets display statistics in many different forms, from tables of interface errors/discards to graphs of internet utilization on your firewall (btw, we keep all max and min datapoints, forever. We don’t average them out). From the number of connections on a load balancer’s virtual IP address to read/write IOPS on your storage cluster. From availability summaries to packet loss/latency graphs. These widgets are organized into dashboards based on device type or location, such as your main datacenter, or to anything you’d like as you can apply custom properties to each device and filter accordingly.
Dashboards:
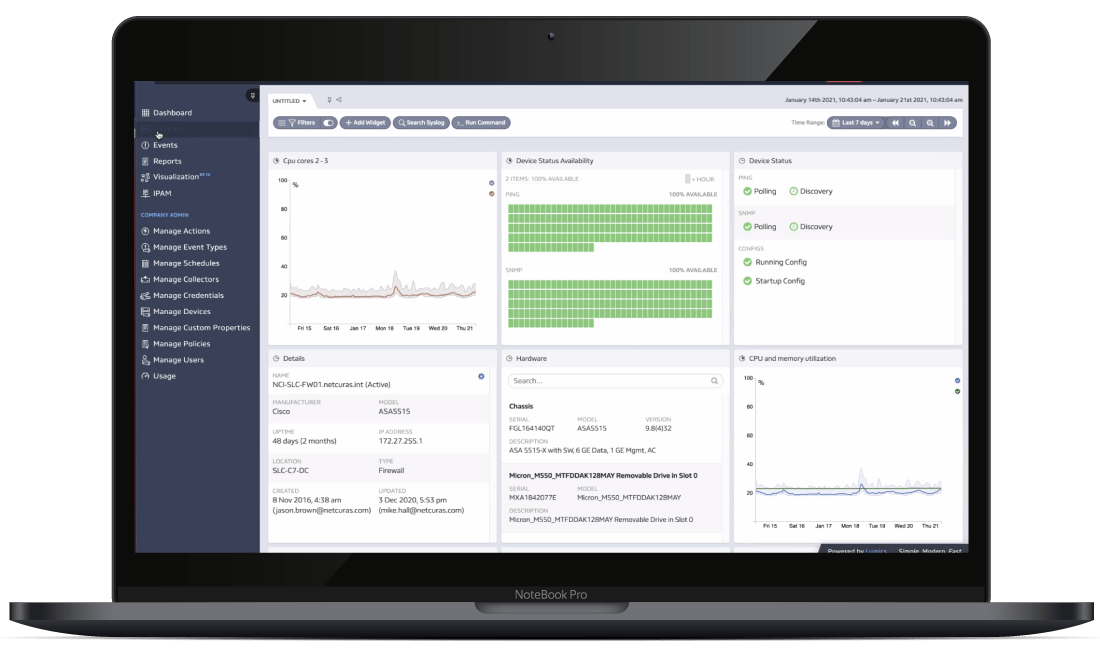
As mentioned above, Lumics implements dashboards, which are a collection of widgets, to present your data. These include a company dashboard, individual device dashboards, executive summary dashboards, and coming soon, security dashboards. You can customize these or create your own dashboards as you feel the need, then share them with others so everyone can see the same data. All widgets within a Dashboard follow the same time frame, so as you need to see what is happening in your environment at a certain time, all widgets on the dashboard refocus on the timeframe selected.
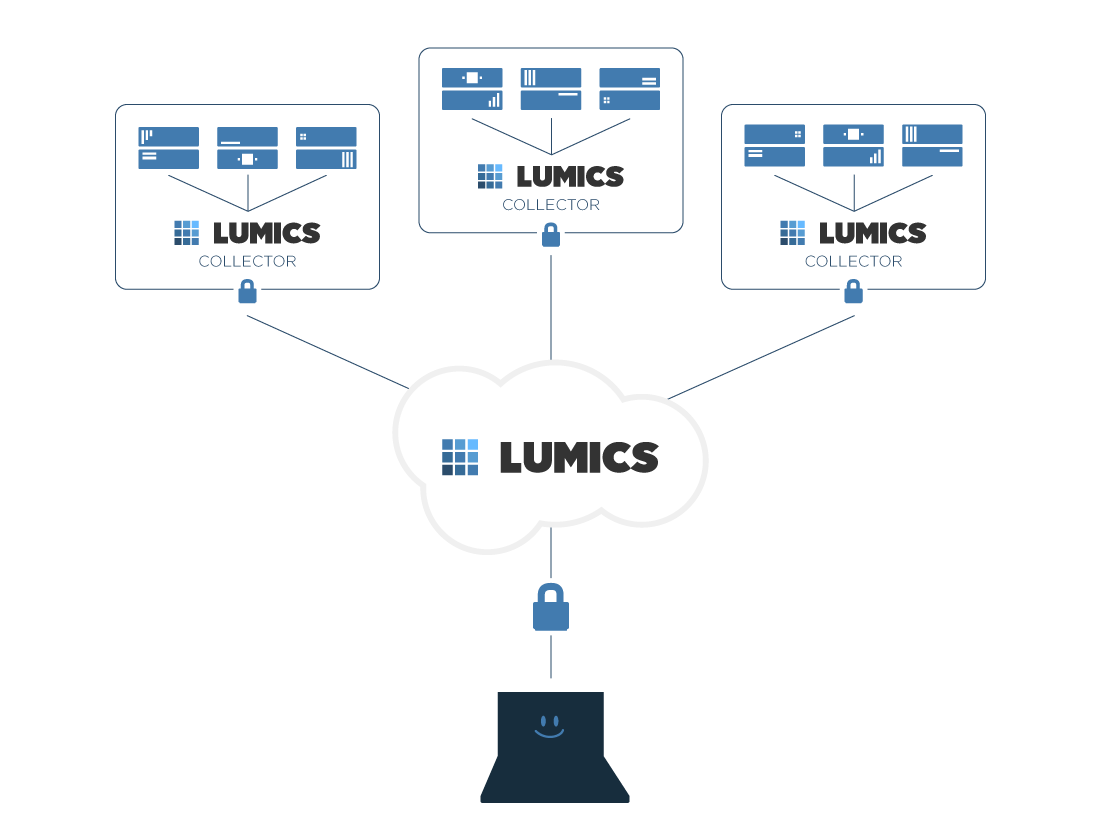
Lumics utilizes lightweight, linux based collectors. The collectors installed in your environment and require a small footprint (4xCPU/8GB Ram/40GB disk), to send collector data back to our private cloud. This is done securely using a REST API over an SSL tunnel.
Simple
Lumics simplifies installation and requires zero maintenance. Spend less time worrying about your monitoring system and more time managing what matters.
Modern
SaaS architecture means minimal footprint and no capital expenditures. Enjoy advanced analytics, alerting, and scalability anytime, anywhere.
Fast
Spend less time waiting and more time visualizing. Large datasets and time ranges are no match for our sophisticated aggregation techniques.
Technologies We Support
[ditty_news_ticker id=”5182″]
We can monitor anything! If it has an IP address we can provide historical data on that device. Lumics supports monitoring via a number of technologies which include: snmp, syslog, api calls, WinRM/WMI, URL monitoring, TCP port checks, storage systems, F5, Vmware, Elastic search
HOW WE DO IT
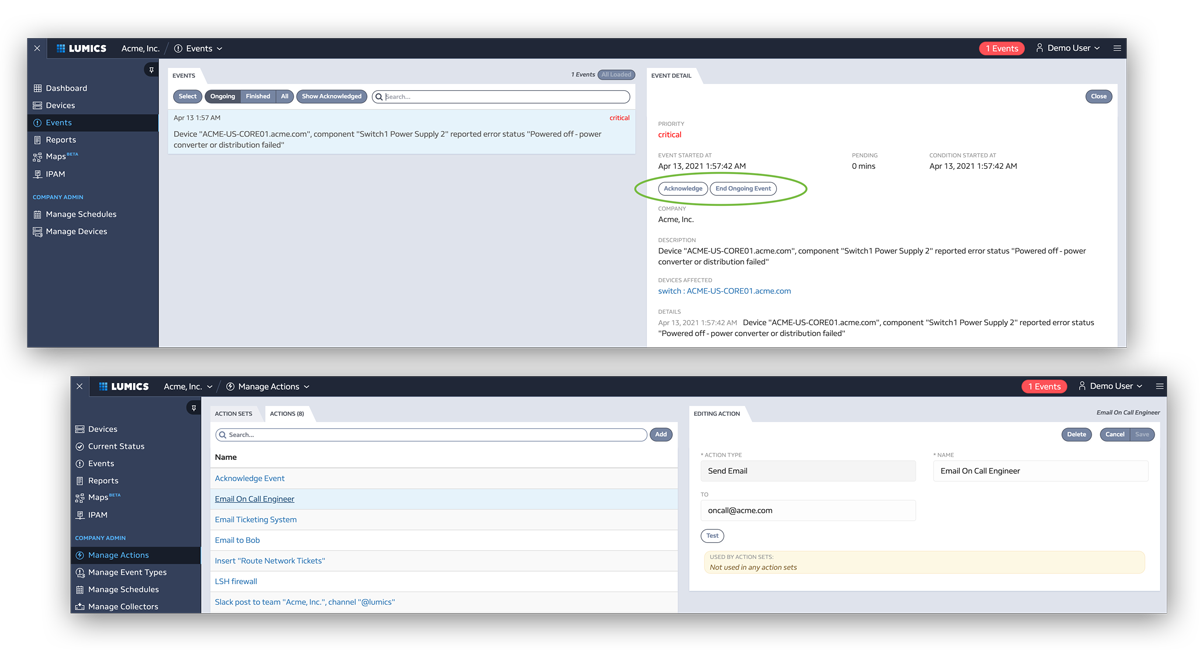
Lumics polls data every single minute! If there is a problem happening in your environment you can rest assured you will know about it. Make sure you stay in the know by utilizing custom actions to deliver accurate information. These actions allow you to send emails, texts, post into slack, and more!
WHAT YOU SEE
Lumics presents your data via widgets. These widgets can be customized and placed on a dashboard. You have the ability to modify or change these up depending on what you want to see. Dashboards can be created and shared amongst peers.
- Global dashboard
- Device dashboard
- Widgets
- Global
- Device § Routers
- Firewalls
- Switches
- Load balancers
- Etc…
INTRO PARAGRAPH INTRODUCING SECTION…
+ Screenshots of platform
NOTES:
- Dashboards: 2 types
-
- Global
-
- Devices
- Widgets: 2 types
-
- Global
-
- devices
- Routers, firewalls, switches, load balancers
- Maps
- IPAM
- Events, alerts, actions
- Reports
TECH SHEET DOWNLOAD:
It’s all about the Outliers
Immersive widgets intuitively reveal what matters and provide a rich user experience for sorting, filtering, and visualizing important events to revolutionize your network monitoring workflow.
Visualization
Create flexible, informative, and shareable dashboards and reports to keep your team on the same page
Stop the noise
Rely on built-in or custom events to trigger actions and integrations to keep your team informed, coordinate escalations, and minimize time to resolutions. Anytime, anywhere!
Be in the Know
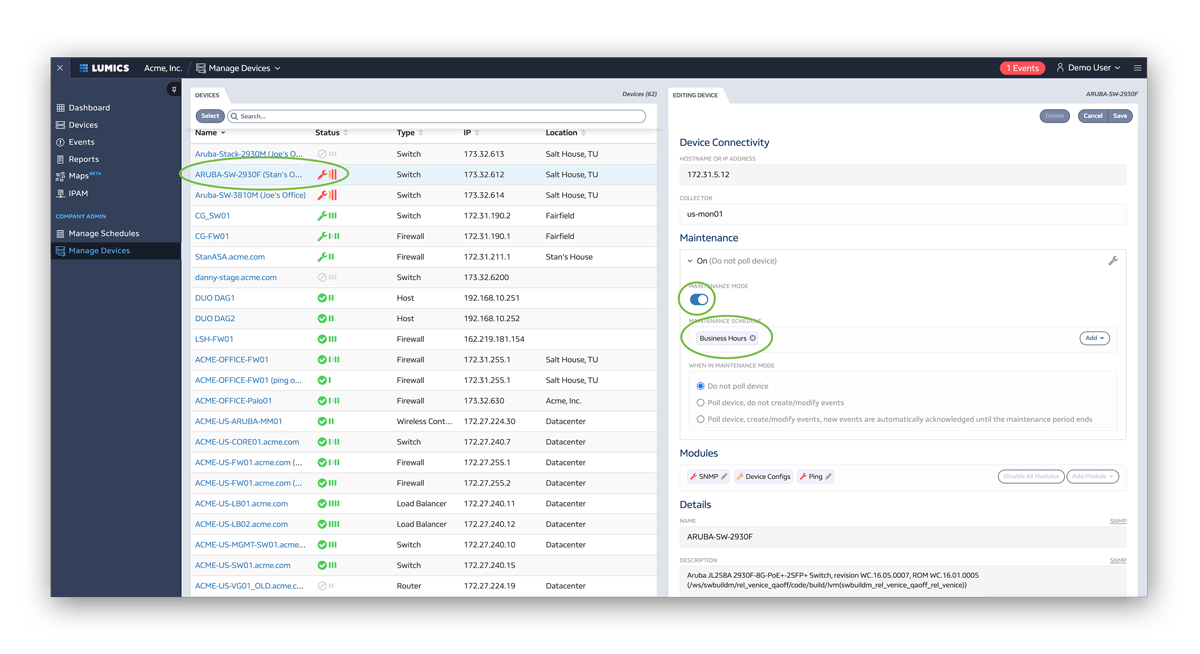
Noise is the enemy of actionable insights in network monitoring. Leverage custom criteria and schedules to quiet regular maintenance and known issues.
“Lumics has been one of our best investments in our infrastructure.
It has enabled our team to identify and respond to incidents quickly and effectively. The system is highly scalable while remaining responsive without taxing our on-premise environment. Their team is committed to making the product better for us as the customer. Their rapid speed of deployment combined with being cloud native has made introducing new features simple on our team while increasing our visibility and capacity.”
—Senior Network Architect
Small to large enterprises and managed service providers alike get cost effective, best-in-class network monitoring with simplicity, scalability, and lightning fast load times.
You deserve better. Let us show you.


