Immersive widgets intuitively reveal what matters and provide a rich user experience for sorting, filtering, and visualizing important events to revolutionize your network monitoring workflow.
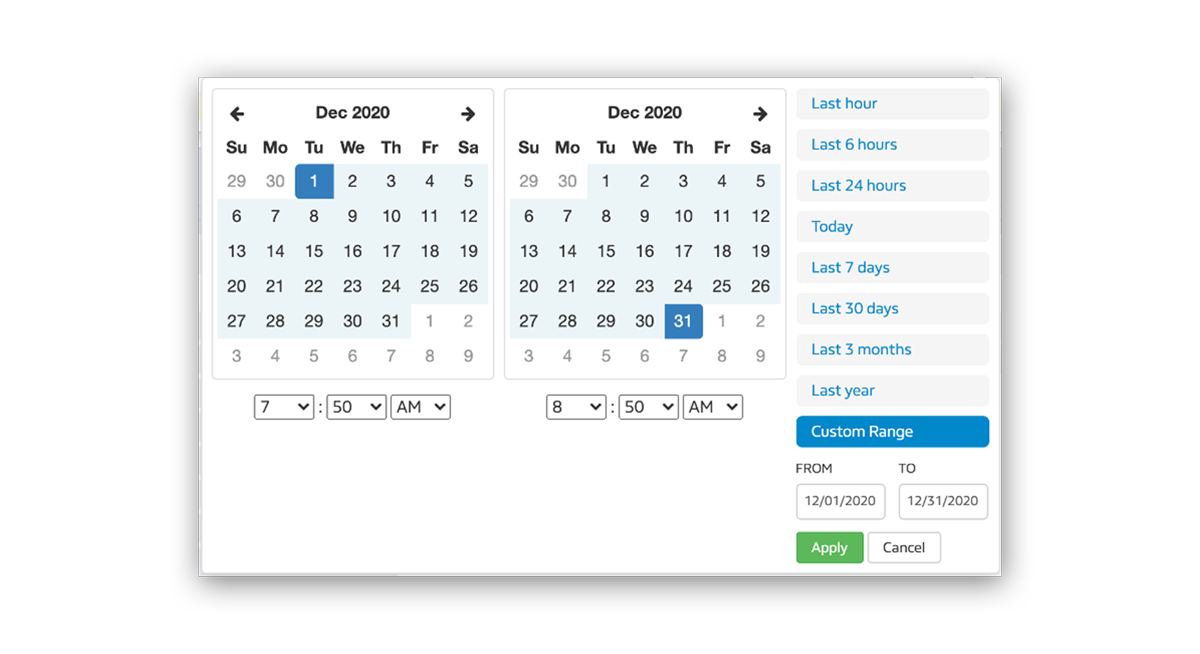
Setting the Timeframe
During the month of December 2020, we saw some anomalies and the tax department has asked us to help. We have been tasked with finding out what caused the problem. First, we need to set our timeframe and limit the amount of data that is presented within our widgets and graphs.
Identifying outliers in your environment can save you valuable time. It can help you isolate the server that has reached maximum disk utilization, the user who is consuming all your bandwidth, or a scheduled backup that is running at the wrong time. Luckily, with Lumics you are quickly able to find the problem and take steps to remediate.
Having established a timeframe, we need to check several different potentials in the Lumics dashboard to help identify our anomalies.
Netflow
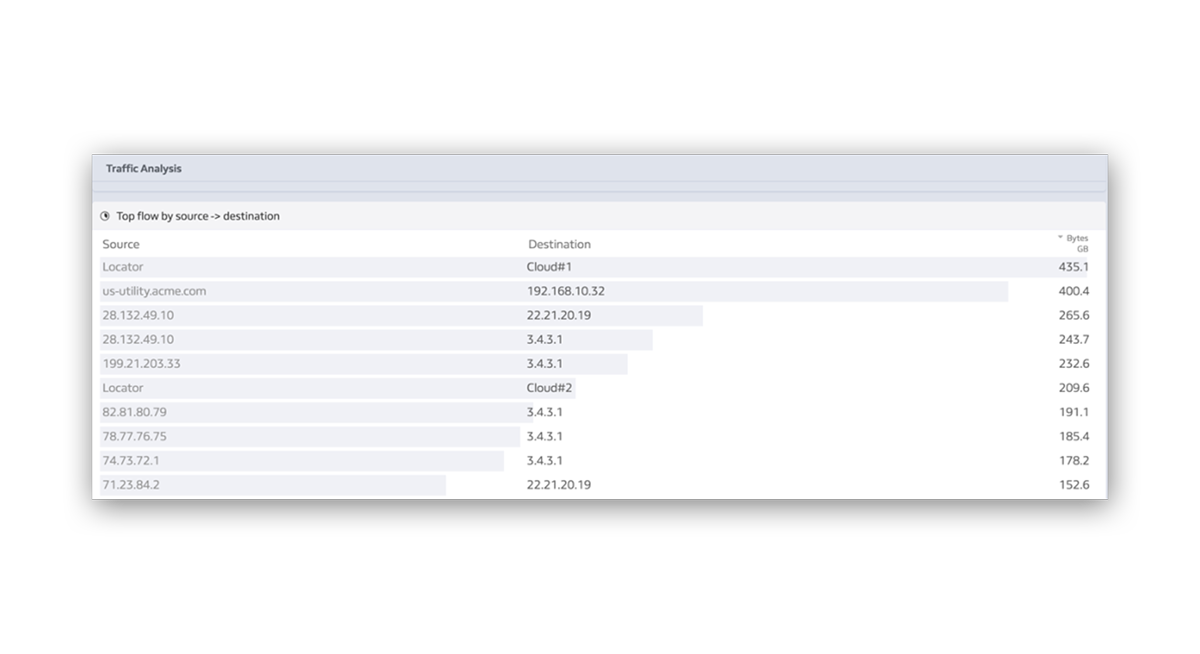
We can view our top flows sorted by source -> destination:
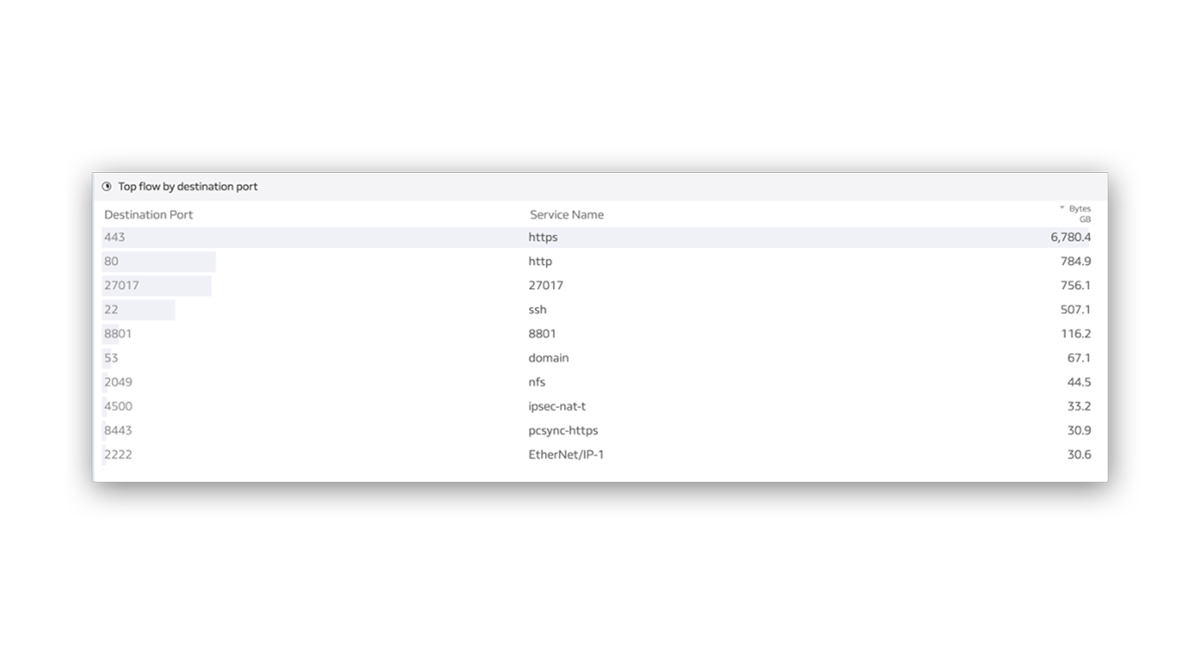
This widget provides us with a quick view of the top talkers during the month of December. Additionally, we can check the top ports and determine if that correlates with what we expect.
With this information we can confirm that this traffic is expected, and we do not need to investigate any further. We will check interface utilization and see how that looks.
Interface Utilization
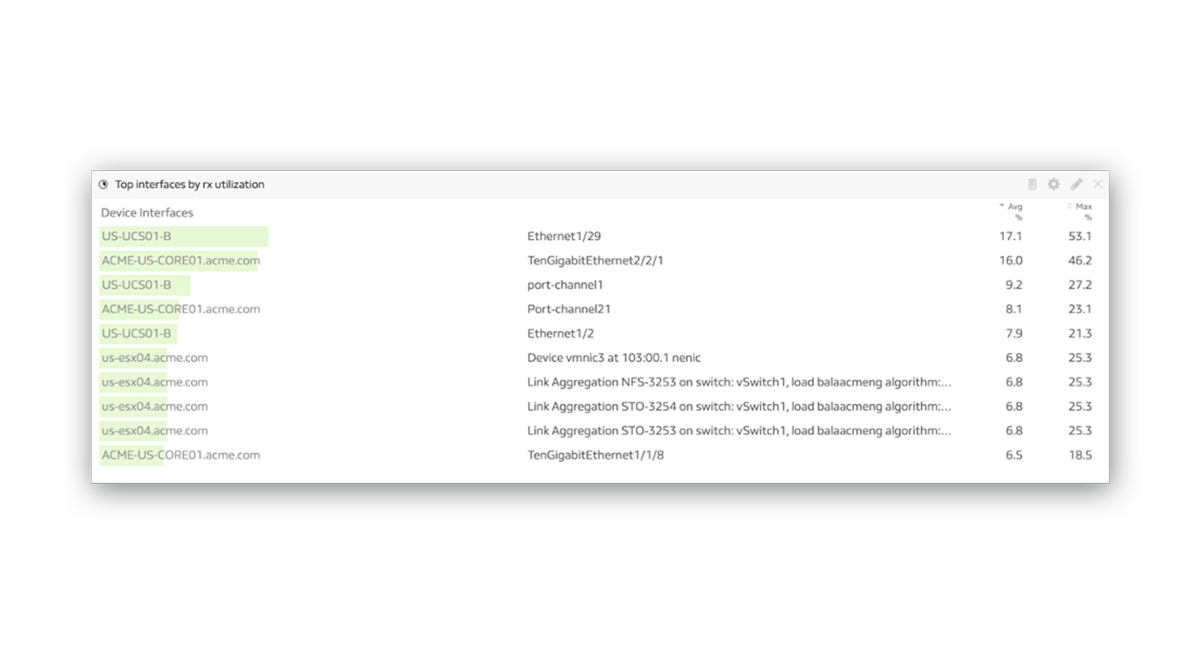
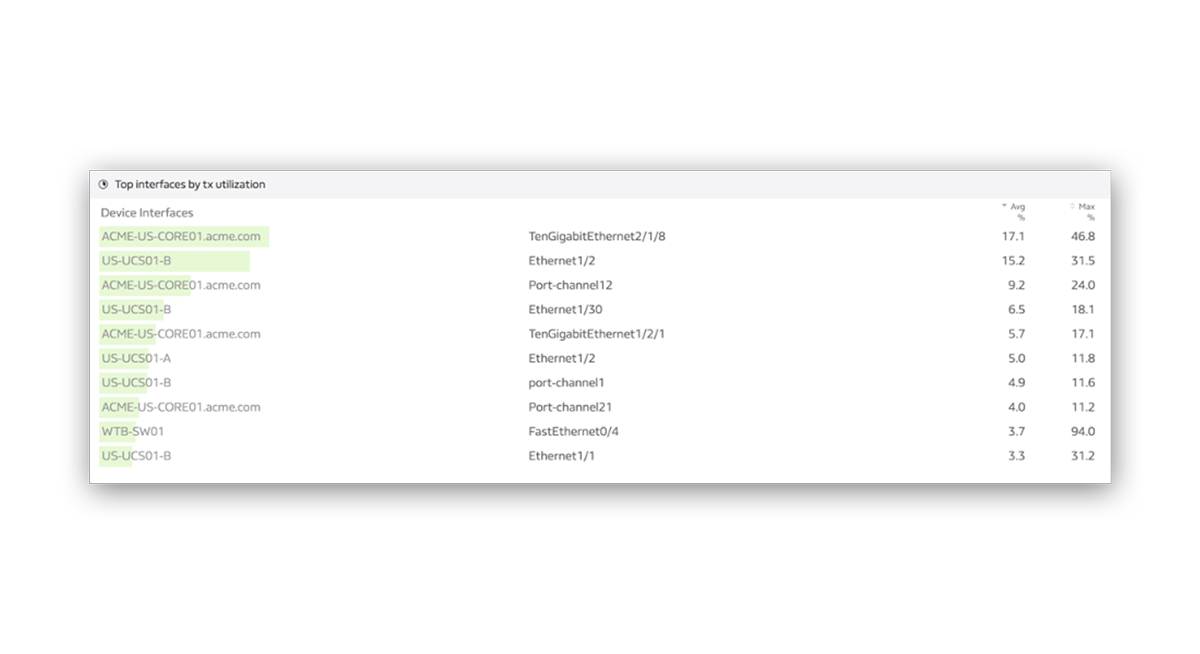
We can often identify a trouble spot with an over utilized interface. Below we can see our receive utilization (rx) and transmit utilization (tx).
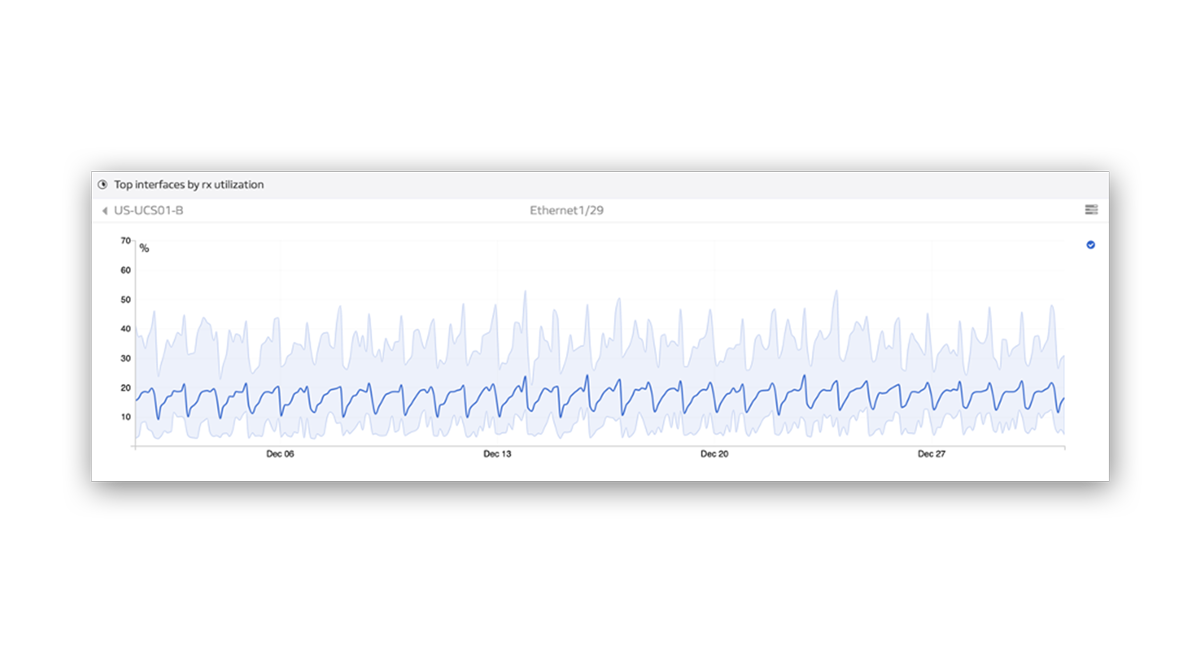
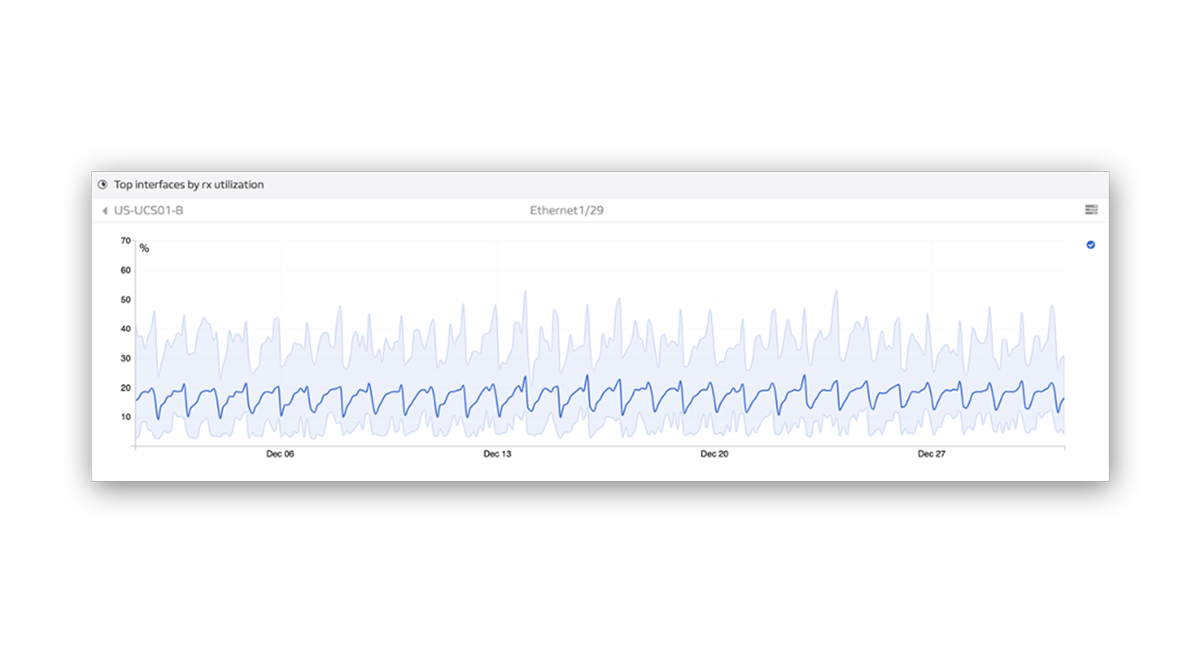
If we were unsure if this was considered within normal parameters, we can quickly graph an interface and view the history over our set timeframe. (Interface US-UCS01-B)
With this information we can confirm that this is normal traffic. One final location that can be beneficial to check is disk utilization.
Disk Utilization
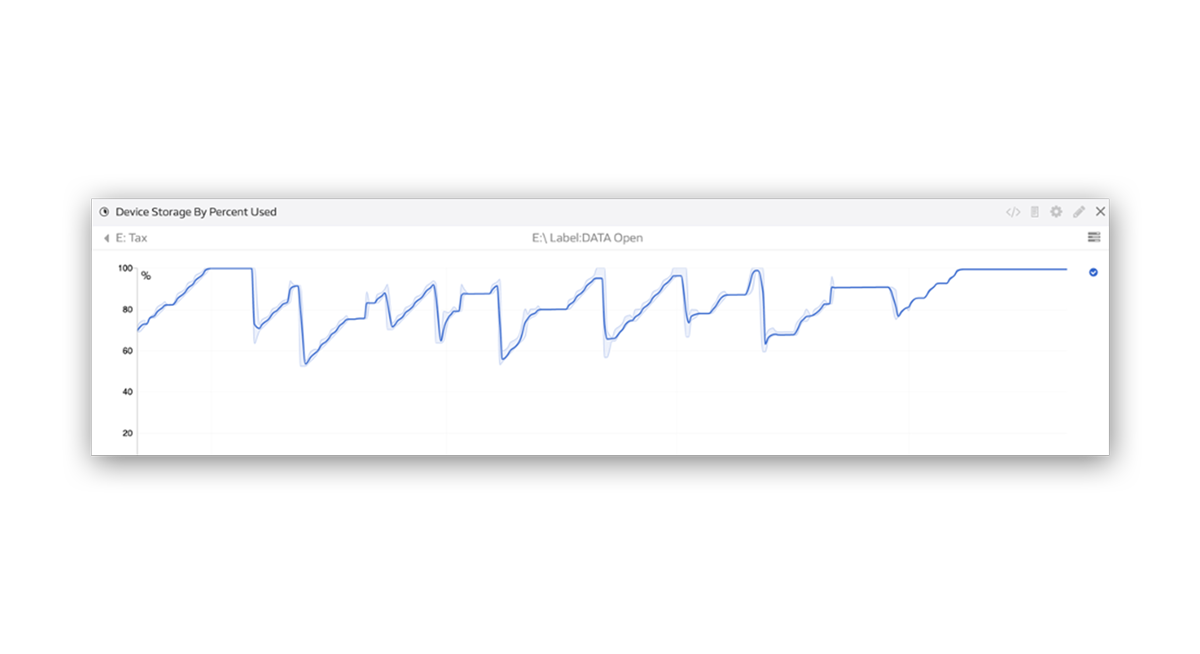
We can see that the tax drive is running at 99.3 percent used. If we quickly check the history of this drive, we can see that this is high. Something has changed and needs to be resolved.
Conclusion:
We were able to identify the issue and find that the drive was running at near 100% capacity. Once space has been cleared or added the problem will be resolved. This is one example of how Lumics can help you quickly identify network monitoring outliers.


