With just a couple clicks, Lumics provides you with network visualization allowing you to quickly and efficiently see what is happening. Shared dashboards allow teams the ability to focus on what they know and the share. Once they have created the dashboards, they can share all or a only specific dashboards to other teams and provide an equal visual for the entire environment.
Dashboards
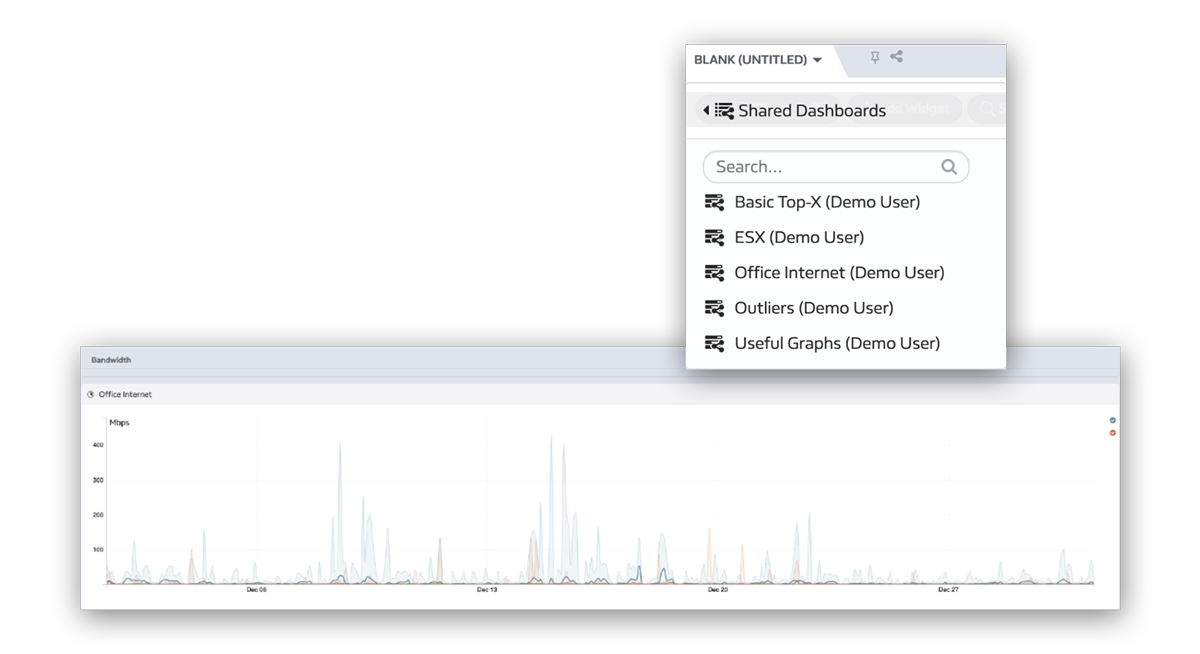
From the shared dashboard drop down you can quickly select a dashboard that applies to you or the issue you are working on.
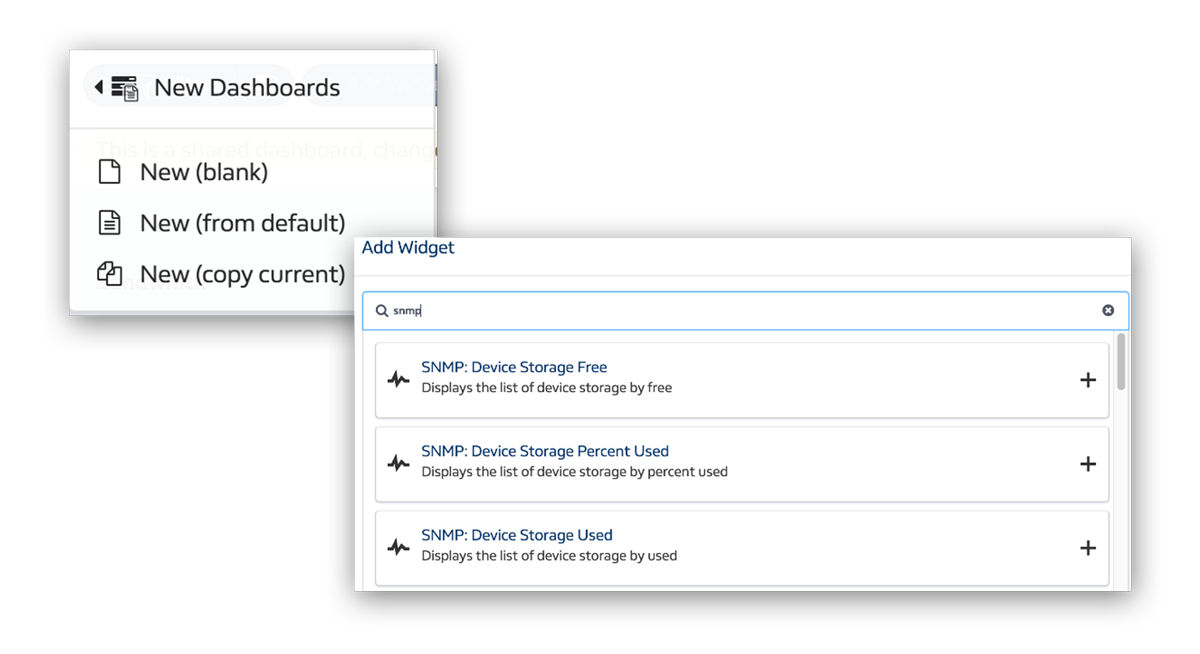
Create a new dashboard with a few clicks and add only the widgets you need. You can also copy an existing dashboard and modify it to fit your needs and share!
Not only does this give a quick, visual information, but with Lumics’ min/max graphing capabilities you can easily identify maximum and minimum utilization over the selected timeframe.
Reports
Widgets operate as real time reporting which removes a large portion of needing to scheduled reports.
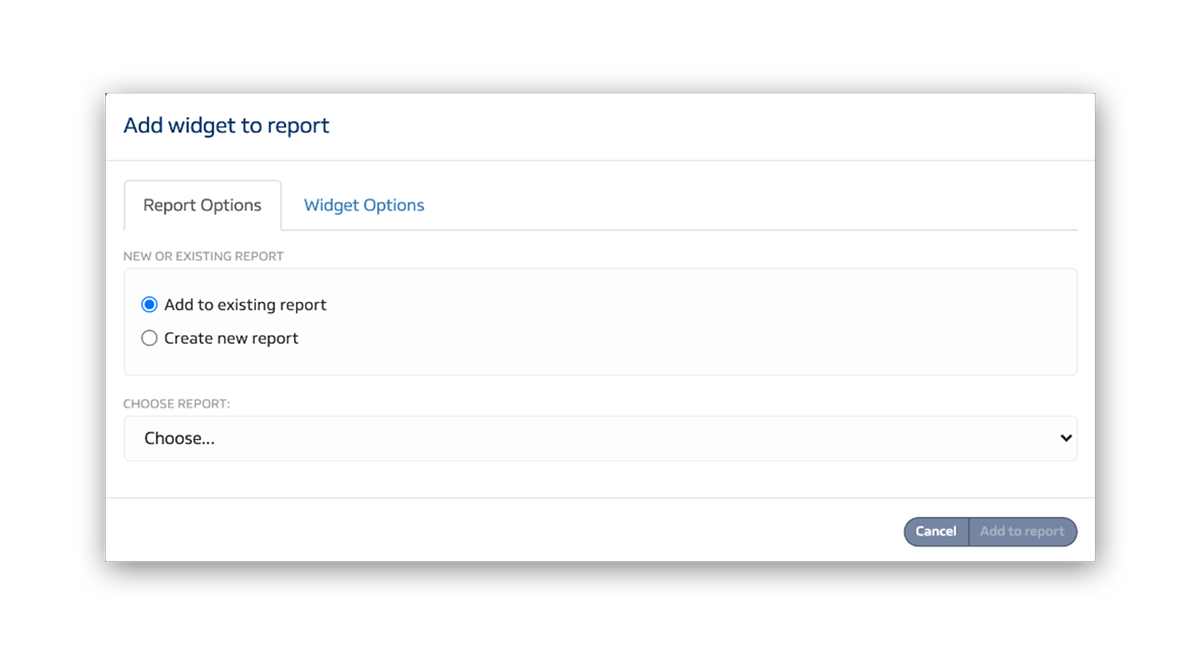
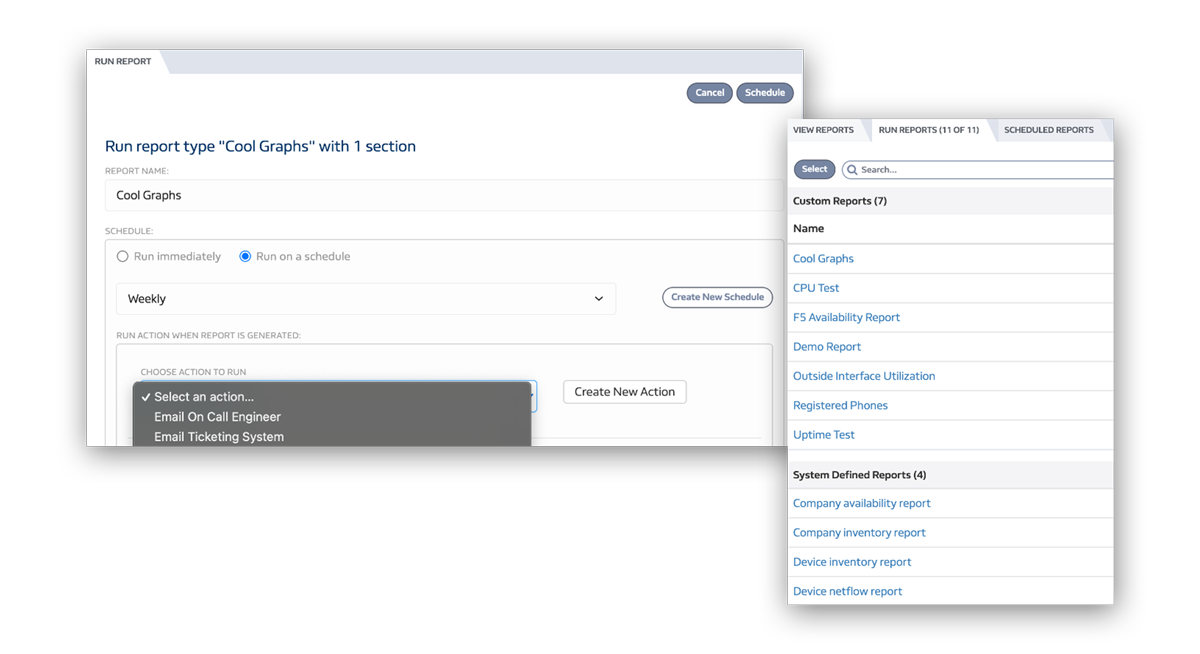
Creating custom reports can be done with any widget that is on a dashboard. The widgets themselves operate as real time reporting which removes a large portion of needing a scheduled report. If you need a report to be run on a specific schedule this can be done as well. Send the report to an email address, distribution list, ticketing system, or text your on-call engineer.
You can run reports manually or choose to schedule them to run on a specific schedule. Once a report has run it will remain in the “view reports” tab until deleted or expires.


