We built Lumics to be the best network & infrastructure monitoring tool available. Here are a few things our customers love:
Cloud Architecture
Buying, updating, and babysitting hardware for monitoring is expensive and time-consuming. You don’t want to pay for OS and database licenses, and have to manage the data storage yourself. You want instant, secure access to the monitoring data from anywhere, at any time, without needing hardware installed in various locations. Our solution had to have a cloud architecture.
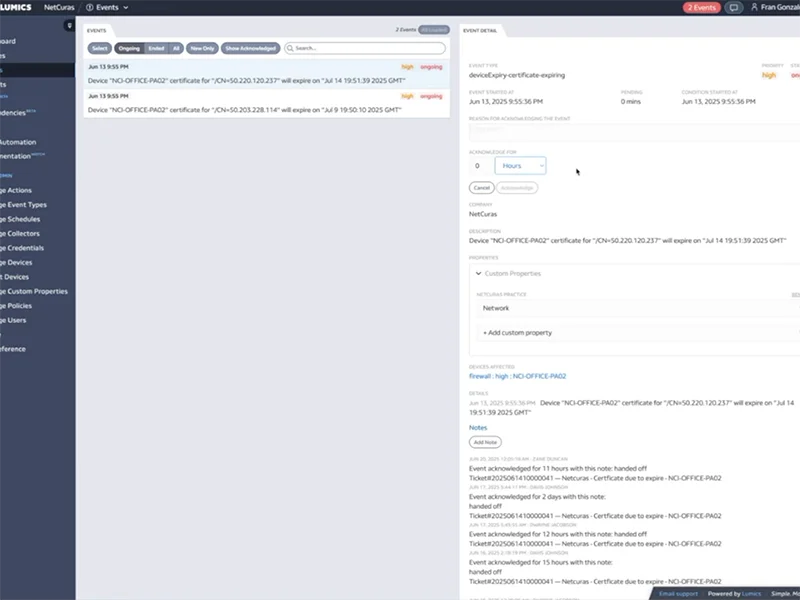
Configurable Alerts
Alerts are great, and necessary, except when they’re not. Sometimes alerts turn into noise or lead to false alarms. Lumics alerts can be configured to take into consideration maintenance windows, device dependencies, and root-cause issues. Alerts can also be sent via SMS, email, Slack, PagerDuty and other popular communications apps using our API and Zapier.
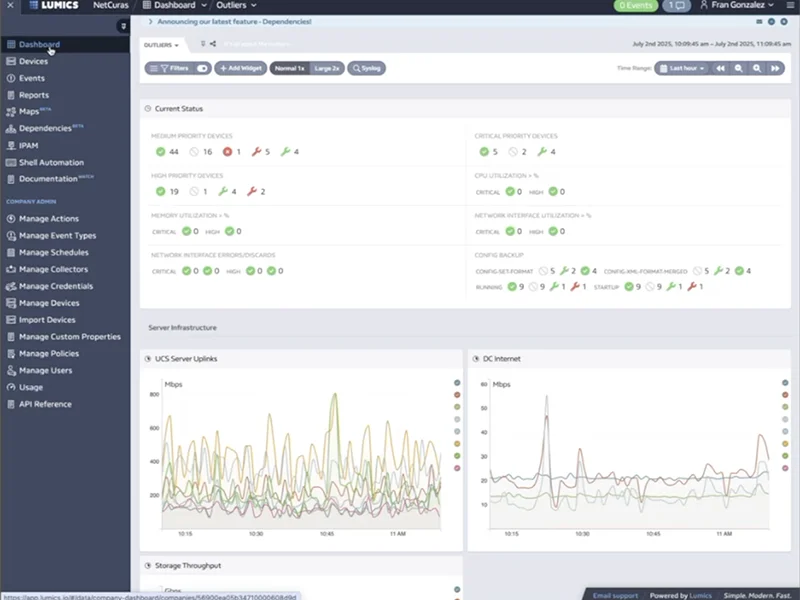
Customizable Dashboards
Out of the box static dashboards don’t tell the right story. You want different people to see different data, and you want to easily switch between various types of information you’re looking at. Then, if you modify timeframes (including historical data from years ago) in one area of the dashboard, you want all graphs and lists and events to instantly be in sync with that timeframe. We created customizable dashboards to let anyone see exactly what they want, when they want, where they want, and we made them wicked fast.
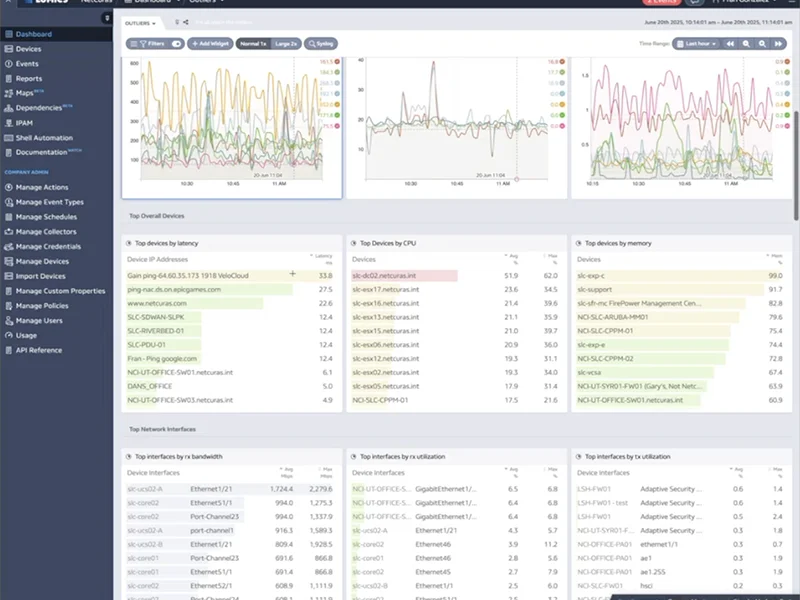
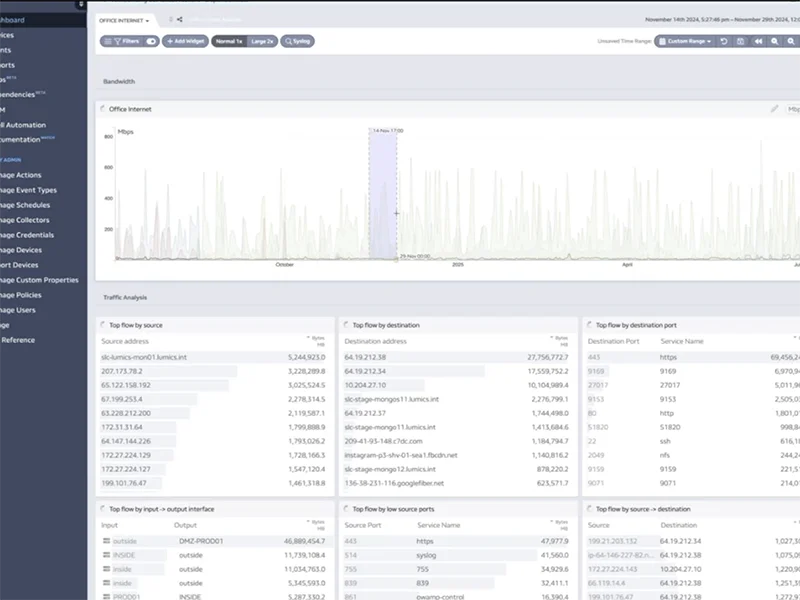
Flexible Data Widgets
Lumics customizable dashboards are made up of any combination of over 100 flexible data widgets that reveal the top offenders in a variety of categories. The widgets also reveal insightful graphs for any selected device or service, and sync automatically across selected timeframes. This makes troubleshooting extremely quick (no critical information is ever more than 3 clicks away). Historical data is saved as long as you are a customer and can be visualized instantly. Lumics’ unique min/max graphing is superior to our competitors’ “averaging” graphs, which smooth out and often hide critical spikes and anomalies that could be extremely insightful.
Fast & Accurate Graphs
Most Lumics competitors are using graphing tools that rely on data averaging to create quick visualizations of performance over time. We designed a unique graphing methodology that is exactly accurate and includes all the min and max bursts so you aren’t misled by the data. Without Lumics, you may be missing important outliers, early indicators, and hidden problems because the data isn’t being represented accurately, or critical anomalies are being averaged out.
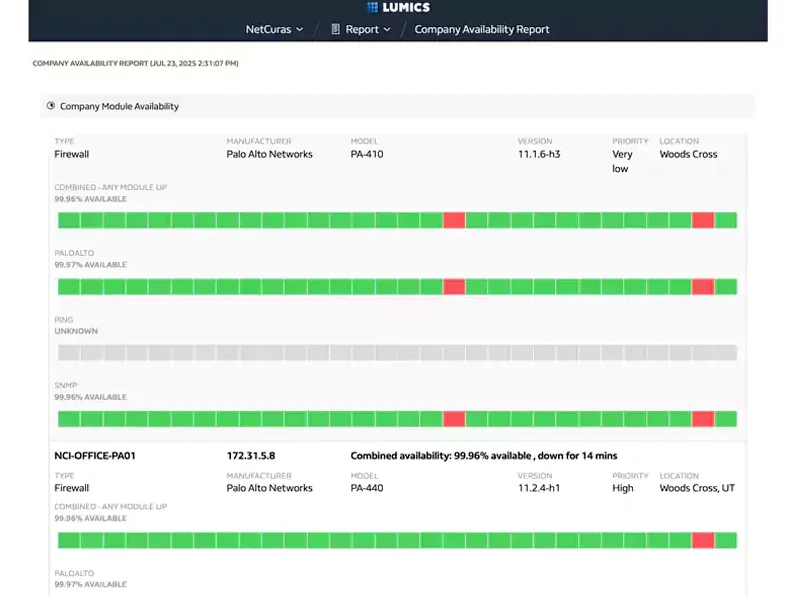
Insightful Reports
Your customers and various executives in your company that aren’t monitoring the network daily still want to know how things are going. What happened this week? this month? Is that better or worse than historically speaking, especially at the same times of year, days of the week, etc? How do our different configurations compare vs each other? Where are there potential problems? What hardware needs to be upgraded as we scale? If we’re having network issues, what’s causing them? Lumics allows you to create customizable, shareable reports that can be automated to send at specific times and contain the key information that various people inside and outside your team need to know.
Config Management
When performance changes on your network it’s often related to a configuration change on a device. Before Lumics you might run a report and spend hours sifting through data and systematically troubleshooting to isolate the problem. Especially when “you-know-who” didn’t want to admit that they made a config change that might have blown up the network or brought things to a grinding halt. With configuration histories in Lumics you can instantly compare changes over time on a single device, or visually compare config differences between two devices to get to the root of a problem quickly.
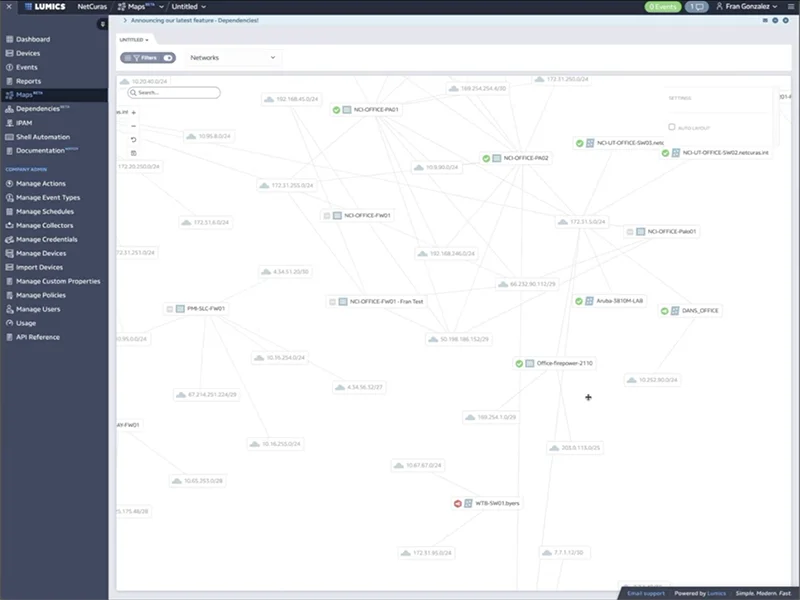
Mapping
Visualizing your network and how it’s all connected can be extremely helpful for planning, efficiency, and troubleshooting. Lumics offers network mapping in four different formats: Topology, Dependency, Geographic, and Logical. Each view provides unique value in revealing where your devices are physically located, how they are connected to each other, and which devices are dependent on each other.
Ask the Guru - all the answers to your deepest questions!
The Guru knows all. Here are some common (and uncommon) questions we’ve asked the Lumics Guru, with links to the Guru’s answers. No need to climb the mountain, smoke Ganja, or do an extended fast – we got you!